Author Archives: Robert Alfonsi

University of Surrey collaboration and Envilution air pollution test chamber

A while back, I wrote a post about testing an earlier version of the Pollution Guardian prototype in the University of Surrey’s Envilution® laboratory test chamber.

A key point of using the chamber was to be able to objectively assess how well individual particulate matter and gas sensors performed, compared to high quality laboratory measuring equipment, in the controlled conditions of the lab test chamber.

Pollution Guardian prototypes installed inside the Envilution® chamber at the GCARE’s Air Quality Laboratory

Pollution Guardian prototypes installed inside the Envilution® chamber at the GCARE’s Air Quality Laboratory

Any issues found with sensors in the lab, are likely to be more significant in real world testing. In fact, the Envilution® chamber has helped us triage some significant issues with gas sensors over the course of the project.

The collaboration with the University has extended beyond the lab into the on-road field testing activities. On multiple occasions we have tested a car loaded up with Pollution Guardian prototypes and high grade laboratory test instruments. This was in order to compare the performance of prototypes in real life conditions i.e. with rapidly changing levels of air pollutants combined with environment changes to the car interior via the action of the car air conditioning system.

High quality test gear installed in-car alongside Pollution Guardian prototypes

High quality test gear installed in-car alongside Pollution Guardian prototypes

In the video below, Professor Prashant Kumar, Founding Director of the University of Surrey’s Global Centre for Clean Air Research (GCARE) summarises the status of the Pollution Guardian work and his team member, Dr. Hamid Omidvarborna, tells us about the Envilution® test chamber.

Pollution Guardian: update for UK’s Clean Air Day

Thursday 17th June has been nominated as “clean air day” in the UK so a good time for an update on the Pollution Guardian project.

Three mechanical concepts for the Pollution Guardian in-vehicle sensor

As mentioned in earlier blogs, the Pollution Guardian is our project to develop a low cost solution for monitoring and alerting road drivers to areas of high air pollution and so enable them to take counter measures. We have been working on this project together with the University of Surrey and it is supported by an Innovate UK grant to prove the concept and further develop prototypes.

We have now come to the conclusion of the current phase of work which has involved:

  • Construction and characterisation of 20-30 prototypes with an updated electronic and mechanical architecture
  • MVP (minimum viable product) development of a mobile app geared to consumer test
  • Cloud back-end development to support data capture and visualisation on the mobile app
  • Collaboration with a UK facility management business to run a solution trial in Q1/2021
  • Analysis of pollution data and user experience feedback to guide the next steps
  • Creation of short films to help us explain the project (see here)

A couple of credits here to the people who have been helping us achieve some of the above:

We will be creating a few more blogs and releasing some additional films covering the more recent work in the coming weeks, so watch this space.

Why bother with the Pollution Guardian?

Busy North Circular road

Introduction

As we arrive in the final quarter of our Innovate UK sponsored project and with an ongoing Covid pandemic, it is worth us asking the question why are we bothering with the Pollution Guardian? Let’s start with the facts:

Thus, we have a significant health and air quality issue, made worse by vehicle use, but which is potentially most harmful to the vehicle users themselves. The obvious solution would be to get more people to drive less or drive more zero emissions vehicles but:

  • Changing habits and lifestyle is tricky to pull off.
    • Whilst we have achieved remarkable things during the pandemic, are we motivated enough to address the silent killer of poor air quality?
    • Unfortunately, the evidence is pointing otherwise as ride as a service and online to home delivery services can push up road congestion and air pollution
  • What about electric vehicles?
    • The UK government’s stated aim is to ban sales of new combustion engine vehicles starting from 2030/2032/2035 depending on whom you choose to believe.
    • This is a potentially worthy objective but there are big challenges: charging points, range anxiety and the affordability of electric vehicles.

So, what can we do about it now?

The Idea

Well, whilst in a car as driver or passenger, you can control your own ventilation by rolling up the windows and using the air recirculation button. This has been shown to have a big impact on exposure to poor air quality .  We took the view that it ought to be possible to make an affordable sensor to warn car occupants of poor AQ and so take countermeasures, if we could incorporate existing technology items, smartphones in fact, into the solution. Thus the pollution guardian project was born.

Now we are some way down the line since starting out, how can we assess if what we have been developing could work for people in practice? Our answer: to organise a real life trial incorporating real users, not associated with the project, and let them use the device for a few weeks and listen to their feedback.

  • Are they more conscious of their air quality whilst driving?
  • Has the use of the Pollution Guardian influenced their behaviour at all?
  • What do they like/dislike about the solution?
  • Can we show any differences over time from the data that we gather?

Thus we are engaged now in putting together a real life trial and the next blogs will focus on the various aspects around this.

What happened to the traffic in 2020?

Much has been made over the reduction in air pollution in 2020 during the Coronavirus pandemic. Certainly, the first period of lockdown saw much reduced commuting activity as people were asked to stay at home or work from home and it was certainly my perception that the volume of traffic was less outside of the main commuting times.

Deserted A3 carriageway during lockdown

Deserted A3 carriageway near Guildford

However, this description and picture above are not accurate descriptions of 2020. Driving around West and South West London in August showed that there was indeed plenty of traffic and plenty of air pollution around.

Heavy traffic on Great West Road in London Aug 2020

Busy Great West Road in West London in August 2020

As this blog is motivated by our Pollution Guardian project, you might be interested to see what we observed on the route around West London. Below, some estimates of the Nitrogen Dioxide gas concentration taken en-route from inside the test vehicle over a 10-15 minute period.

NO2 gas concentration vs. time showing rapid change on West London drive

Pollution Guardian prototype NO2 gas level estimates (ppb) against time (s)

Note that whilst the Pollution Guardian prototyping work is still ongoing, the absolute numbers in the graph above were our estimates based on the individual prototype sensor outputs and algorithms at the time. They are however valid to look at as a high quality, lab grade, NO2 gas analyser on board our vehicle, also reported similar or higher gas concentration figures over the same time period.

What does this all tell us?

  • Despite the pandemic, traffic and pollution levels over the summer period in city/urban areas were not so much below the “business as usual” levels.
    • Indeed, the BBC reports that even in the midst of the January 2021 lockdown, motor vehicle traffic is already at 50% of normal levels.
    • This suggests traffic and its associated air pollution will be returning to normal in 2021 when the lockdown eases.
  • Air pollution levels can vary a lot from lower to higher levels of concern over relatively short distances i.e. hotspots are discrete spots.
  • The Pollution Guardian looks capable of following these fast changes in air quality and can be a useful tool to bring awareness and raise alerts on worsening conditions.

Lab testing with the University of Surrey air pollution chamber

As part of the Pollution Guardian project, our collaborators, the University of Surrey Global Centre for Clean Air Research (GCARE) planned to develop an air pollution test chamber for affordable sensor devices to be evaluated against high quality laboratory grade test measuring instruments.

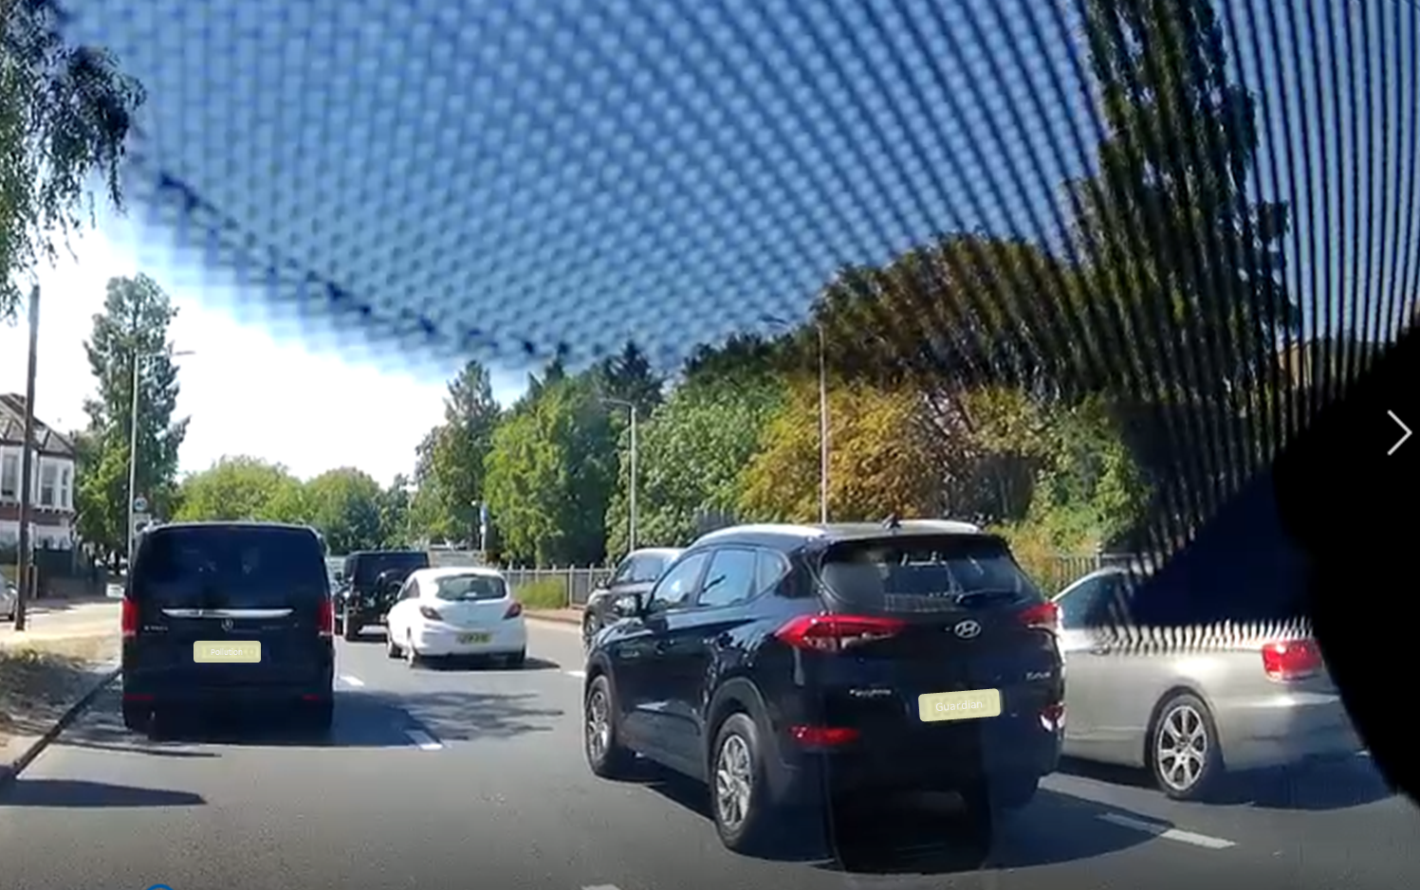
The objective for the chamber was to be able to set up stable, predictable air pollution and environmental conditions to enable the replication of field conditions from ANYWHERE in the world.

In its first iteration, the chamber, subsequently branded “Envilution”, was capable of controlling:

  • Chamber air temperature
  • Humidity, including pre-filtering to create “zero air” as a baseline (dried and filtered air)
  • Particulate Matter (PM) levels, with options to create particulates from a variety of sources
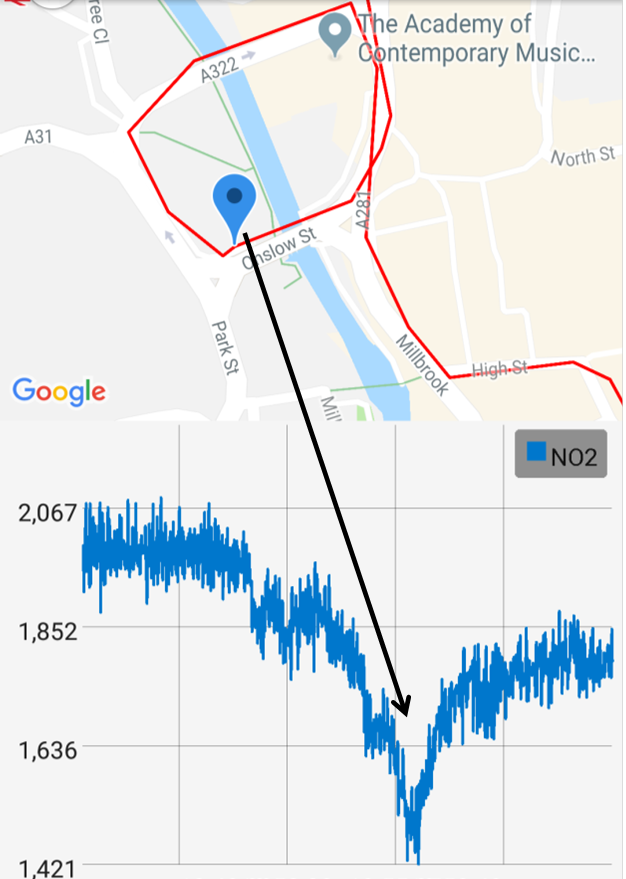
  • Nitrogen Dioxide, NO2, gas concentration

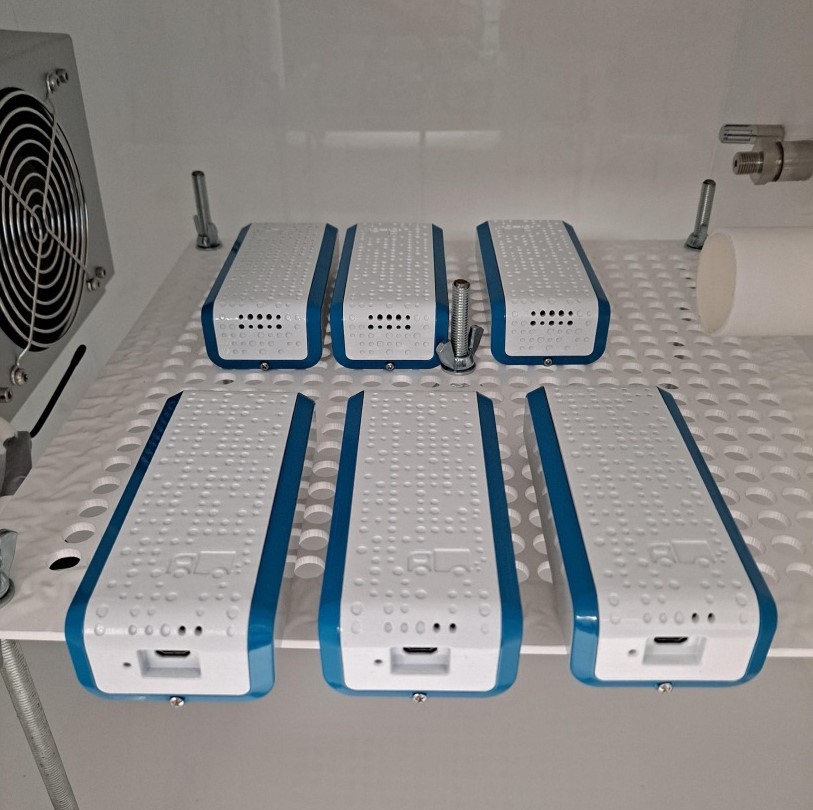
By the end of the second quarter of the project, the chamber was ready to start testing with our Pollution Guardian prototypes.

The Envilution air pollution test chamber created by the University of Surrey

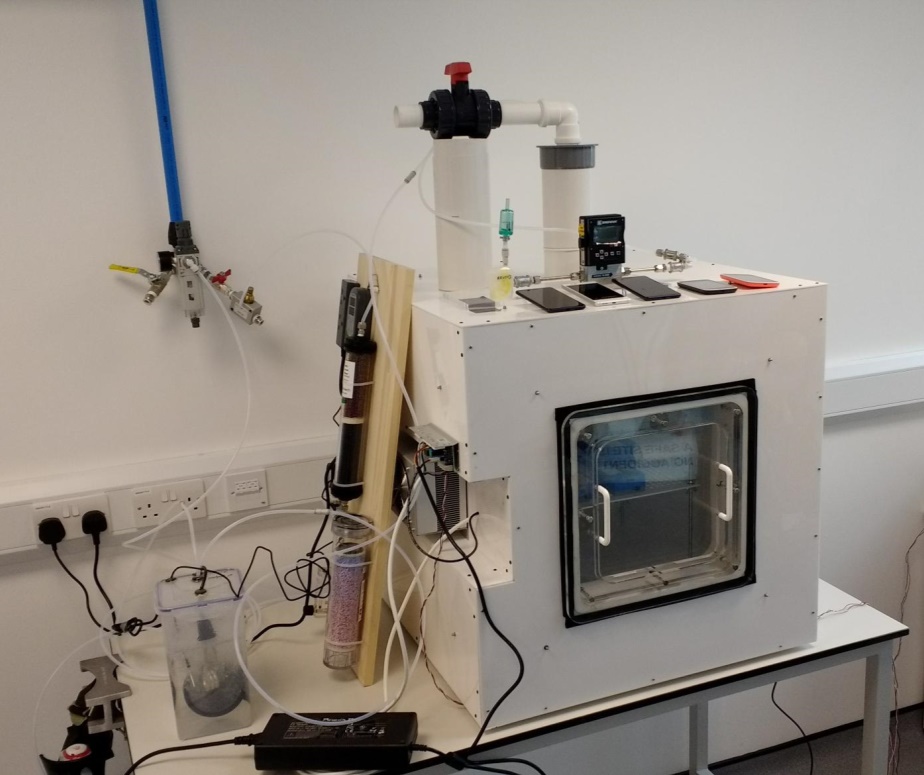
Figure 1: Envilution air pollution test chamber created by the University of Surrey

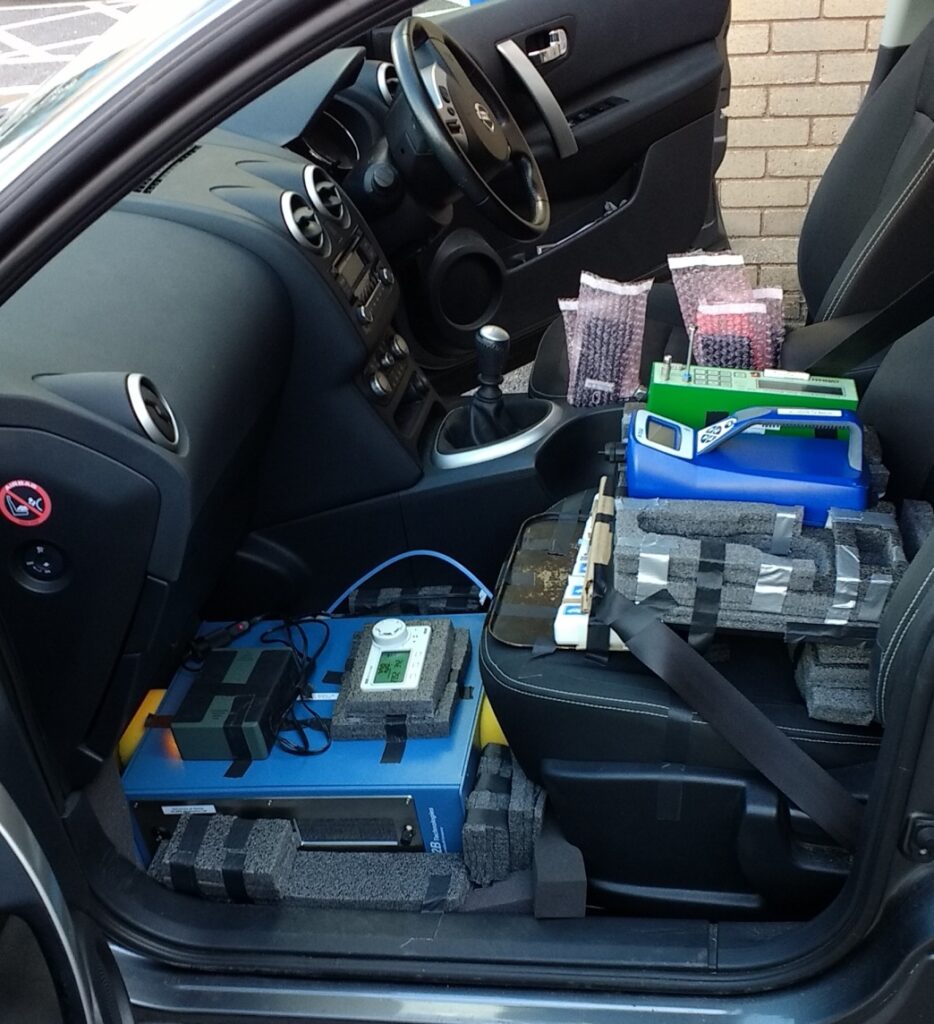
The chamber conditions:  temperature, relative humidity, particulate matter level and NO2 concentration were sampled from a port in the chamber using the same high quality instrumentation mentioned in the previous blog.

In our testing, we planned on exploring the behaviour of the prototype sensor units against changes in the levels of temperature, humidity, particulate matter and NO2 gas concentrations. Whilst some of these tests were more straightforward to set up, others turned out to be more tricky e.g. humidity testing.

Mostly when weather websites predict humidity levels, they actually refer to the “relative humidity”. This is a measure between 0-100% of how much humidity the air is capable of carrying, relative to the air temperature and pressure. As you get toward 100%, you can get a lot of condensation forming on surfaces and in warm conditions struggle to keep cool by sweating.

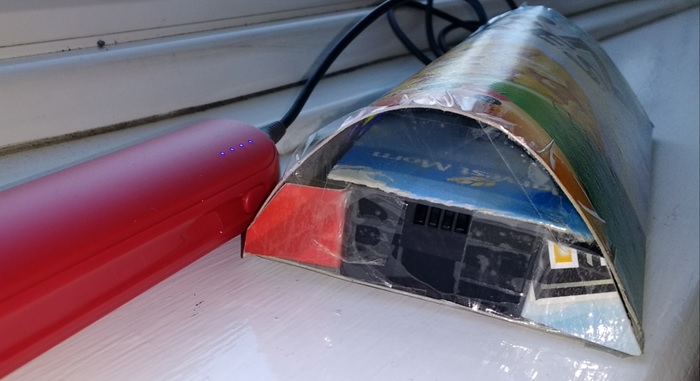
In our lab tests, we aimed to see how our sensors responded overall to the relative humidity in the range of 10-85%. The initial approach was to use an aquarium to generate the humidity and mix this with “zero air” (cleaned and dried) to achieve a target relative humidity.

Set up to deliver zero air and combine with water vapour from an aquarium

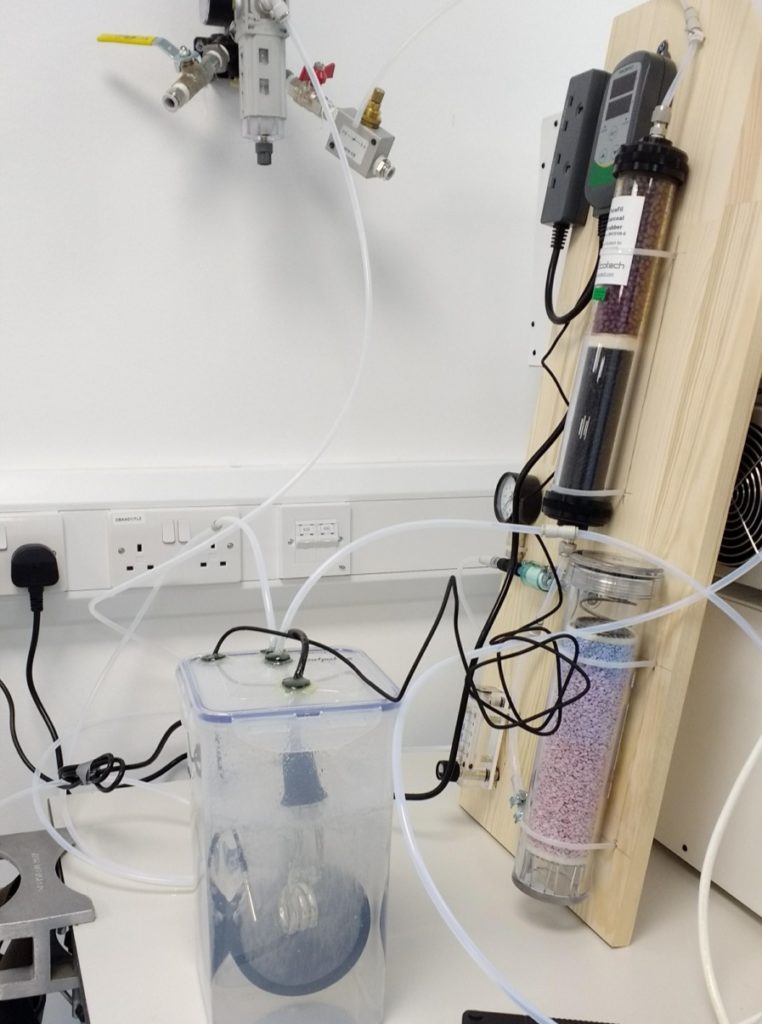
Figure 2: Zero air combining with water vapour from the aquarium

As we discovered, it was quite hard when starting off with zero air to turn this into high humidity air without also having condensation issues within the ducting leading to the test chamber. The GCARE team were however quite resourceful when coming to practical techniques, and we managed to explore the other parts of the humidity range using a combination of a nebuliser to create small water vapour particles and the higher end range of humidity through rearrangement of the sets of connections into the chamber.

I will tell a bit more about the performance of our sensors in the chamber in subsequent blogs whilst briefly mentioning the results from our temperature sensor during a temperature test.

Set of temperature sensor responses during lab test

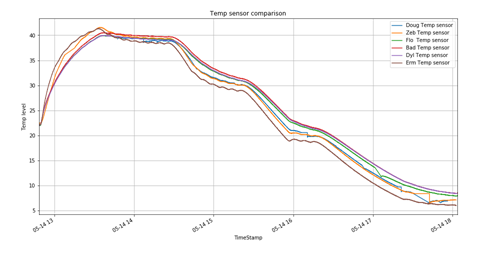
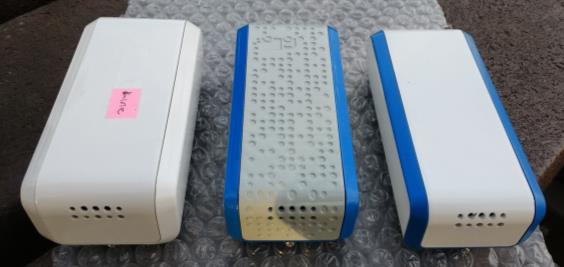
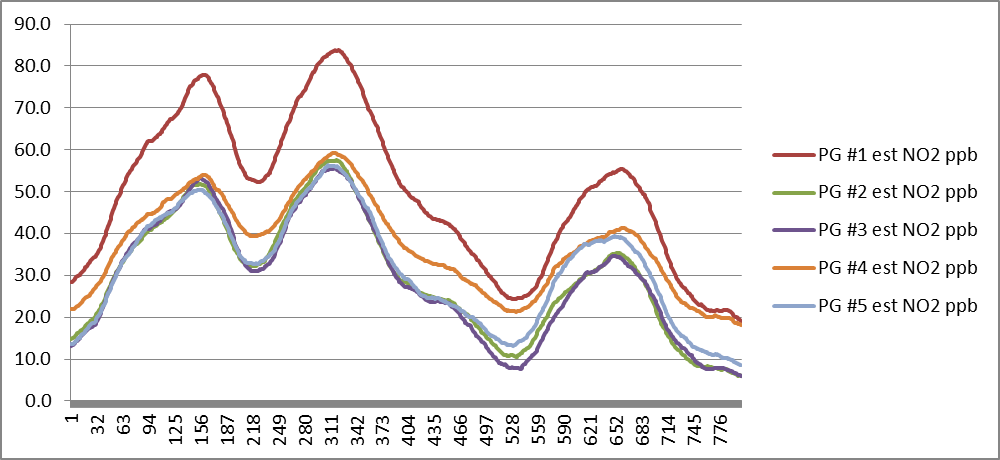
Figure 3: CP1 prototype temperature responses during a lab heating/cooling experiment

The CP1 prototype units’ temperature sensor responses were generally well correlated with one another, but slightly higher than the chamber temperature recording. This was attributable to the internal heat dissipation of the prototype, when in operational mode.


Pollution Guardian: roadside experimentation together with the University of Surrey

One of the first activities together with the University of Surrey’ Global Centre for Clean Air Research, led by Professor Prashant Kumar, was to join a live field campaign to measure the air pollution next to Stoke Road in Guildford, Surrey. The University of Surrey’s campaign measured roadside (pavement) air pollution using both high-end specialised air pollution instrumentation along with more affordable devices.

Stoke Road can be a busy road at peak times and is closely connected to the A3 slip road for London and the South East as well as the direct connecting route to the nearby town of Woking.

Traffic on Stoke Road Guildford

Figure 1: Stoke Road during a morning rush hour.

The setup involved measuring the air pollution at a height of approximately 1.5meters above the pavement, a comparable height for pedestrians breathing in roadside air. Thus the need to brush off some old woodwork skills and create a container and support platform for our units.

Bird box platform for Pollution Guardian sensor units

Figure 2: “bird table” box for holding pollution guardian units

Why measure pollution on Stoke Road? There is a children’s playground right next to Stoke Road, so monitoring pollution levels there is of real interest and also the University has a co-located air pollution measurement station, using sensors from the iSCAPE project. With the support from the Guildford Borough Council, this site is being continuously used by GCARE team as a part of their iSCAPE’s Guildford Living Lab activities.

Now whilst we are designing the Pollution Guardian for measurements in the car, it was of some interest to us to obtain an early view of how our own “CP1” version prototypes performed compared to the specialised air pollution equipment made by GRIMM and more expensive particulate material testers such as Dylos devices.

stoke road air pollution testing campaign site

Figure 3: Roadside setup next to Stoke Road

What were the learnings?

Good results are possible for fine particulate matter (PM2.5) measurement:

  • After aligning measurements in time, we are able to obtain a correlation of 0.8 between Pollution Guardian units and the high-end particle spectrometer.

However, NO2 pollutant gas measurement is difficult in the field:

  • Pollution Guardian NO2 sensor readings were well correlated with one another but..
  • Even after warm-up, we can only obtain 0.3 correlation with a reference measuring unit
    • Some NO2 spikes detected by Pollution Guardian units were ignored by the reference NO2 detector and vice-versa.
  • One effect we could feel and could see in the “spikiness” of our NO2 readings was the impact of a Northerly wind blowing along the road.
    • We would go on to look at how to better protect our units against wind gusts, whilst not compromising our key use case of the car environment.

So, whilst the reasons for lower correlation on NO2 gas readings were not yet clear, this was something we were obviously keen to explore in the planned lab testing with the University of Surrey’s GCARE Air Quality Lab where we would have better control over the environmental conditions.

Update on our first prototype & air pollution on BBC news again

BBC London ran a recent story on air pollution exposure during commuting:

It now seems a long while since our last blog post, but air pollution is barely out of the news with the latest BBC story about air pollution exposure during commuting. This topic is fairly close to our hearts with the pollution guardian activity inspired by the fact that air pollution exposure is highest within motor vehicles.

Earlier on this year, we put together our first prototype pollution sensor containing a particulate sensor for PM2.5 measurement and a Nitrogen Dioxide (NO2 ) gas sensor. PM2.5 refers to the measurement of very small particles, less than 0.0025mm in diameter which can go deep into the lungs and containing a variety of payloads e.g. road, brake or tyre dust or chemical compounds from combustion. Nitrogen Dioxide gas can exacerbate respiratory conditions and at street level is mainly produced by diesel vehicles.

How does out first prototype look?

Close up photo of our first protoype unit

Why did we make this first prototype?

  • to create a self-contained sensor unit with its own internal power supply to enable easier bench and field (car) testing
  • to shrink the volume of air trapped within the unit in order to keep the unit responsive to the current air conditions
  • to enable experimentation with parameters to find the best balance of sensitivity versus stability

We will write a bit more about the “infrastructure” of the prototype and surrounding app and cloud solution in later blogs, but the main question we had when we put the hardware unit together was does it work?

Well, the good news was that the prototype actually worked as expected across a range of functional areas with only one bug with battery charging which was solved by a simple hardware modification to the units.

How well did the units work compared to our initial cardboard prototypes? Pretty good in practice:

  • having “always on” internal power meant that the sensors could be ready to start work within a couple of seconds; previously the sensors could require several hours from being powered up to being ready to measure
  • fast responsiveness to Nitrogen Dioxide gas e.g. able to pick out smelly vehicles passing by

NO2 measurement against time

And where does that spike of air pollution correspond to? A smelly van on the southbound slip road of the M25/A3 junction…

Map of NO2 air pollution hotspot on M25/A3 southbound sliproad


Pollution Guardian: Measuring air pollution with cereal packet prototypes

As mentioned in the previous blog, we put in a lot of preparation work over summer 2018 in order to be able to quickly start work on the Pollution Guardian project and de-risk certain areas. One of the first items to be actioned was the creation of a custom circuit board to explore the performance of our selected, affordable Nitrogen Dioxide (NO2) gas sensors and the type of electronics needed to setup, amplify and filter the output of these sensors. We called it our “bench test” circuit board as we thought it would only get used indoors on the bench..

Bench test circuit board

With the bench test board, we designed a couple of options for the electronics solution:

  • to provide a backup option, in case the one circuit failed to perform
  • provide us alternate options based on relative performance
  • to enable optimisation of the bill of materials cost

Designing & making the circuits went relatively smoothly,  but it is not until you receive circuits that you can really see what is going on. Some mistakes we discovered quickly, whilst others took a period to debug. Mostly our mistakes were due to the misinterpretation of and assumptions on the component specifications; our first solutions to these issues actually went on to compound our problems.

After a period of investigation and debugging, we were finally able to identify and solve the underlying issue. As part of this work, we lashed these prototype circuits together with an off-shelf development board (TI cc2640R2) all contained in a cereal packet wrap for protection. We called our first units  Dougal & Zebedee and took them out of the lab and into the car:

Dougal and zebedee prototypes

What we found when we started testing out the units was that whilst our units appeared quite sensitive to temperature change, they were actually capable of detecting low levels of NO2 inside the car.

The picture below shows a trace of NO2 measurements whilst traversing the one way gyratory system in the centre of Guildford – note that a decreasing level on the graph trace implies a higher NO2 concentration:

Air pollution on Guildford gyratory system


So, at the conclusion of our cardboard proto work, we knew we had the right potential sensitivity toward NO2 which we could work with on the next prototype to calibrate and try to get consistent between test units.


Pollution Guardian: From competition win to prototyping

BBC cartoon programme Magic Roundabout characters

Magic Roundabout characters

Feasibility projects like the Pollution Guardian imply a certain level of risk and it was critical for our business to secure some grant support from Innovate UK to help us mitigate those risks.

Looking back, it seems a long time since we made our application for funding, but considering the risks ahead, we prepared ourselves in order to get started quickly in case of a positive outcome of our bid:

  • Working on the system architecture, driving decisions on the hardware and software platforms to use within development
  • Further research on the key components
  • Talking to collaborators and contractors to re-check availability
  • Re-planning the market research

Now, many academic papers point to the difficulty in using affordable sensors e.g. around variability, stability and accuracy, so one of our biggest challenges in the project is to put together an affordable solution based on these sensors. Our approach was to tackle this issue head on, building a very early prototype and using a minimum “data gathering platform” around it to understand the pitfalls & performance issues.

This early work cut across several disciplines:

  1. Electronics, designing a custom circuit to best interface with affordable gas sensors
  2. Firmware, building on a development platform to gather and share sensor data over wireless
  3. Mobile app, customised to gather the local sensor data & upload it to a data store
  4. Mobile backend, a real time database to capture the data streams and tools to help explore the data
  5. Mechanics, how to wrap this early prototype for real world use
  6. Early system testing & validation approach

We will be adding a few blogs to the site to cover progress on the above items; suffice to say the first mechanical housing for the unit followed the “breakfast cereal box” approach. After wrapping up the first sensor unit, its looks gave us the name for our prototype, Dougal, after the dog character from the programme, “The Magic Roundabout”.

Dougal, the Pollution Guardian cereal box prototype

Sensing the Air Quality

Venue for sensing the air quality and emissions program

In our home page, we mentioned that within product incubation, we were working on our own solution activities. The area of interest is within the internet of things (IoT) and is  targeted at low cost air pollution/air quality (AQ) solutions at this time. Thus we were pleased to participate in the 46th Intelligent sensing program, organised by the UK knowledge transfer network.

What were the main learnings from the event?

  • Big concerns on the level of small particulates, specifically PM2.5 and below.
  • EU AQ measurement standardisation is scoping “informative” sensing solutions.
  • Growing interest in AQ sensor networks.
  • UK government desire to leverage crowdsourced pollution data.
  • Key sensor criteria & findings from low cost sensing components.
  • Urban & journey pollution mapping.

Particulates

Can we meet the EU reduction targets for PM2.5 particulates by 2020? Should we be counting the number of particles rather than particle mass/m^3? Just one PM10 particle weighs as much as 1000 PM1 particles.

AQ sensor networks

Presentations from Alphasense and AirMonitors Ltd. pointed to the additional value coming from “lower than reference” quality sensors connected up as a network e.g. the ability to dis-aggregate pollution sources.

Crowdsourcing, sensor criteria and findings

The UK Environment Agency are looking to identify how they can better leverage crowdsource AQ data as a larger monitoring network than their existing 150 reference stations across the UK. However, the main concern is over the quality of this data. This then leads us to think about the air quality sensor and sensor system criteria:

  • Sensitivity: enough for the purpose e.g. movements within the general background outdoor AQ level
  • Specificity: responding to a specific gas pollutant and not being easily spoofed by the presence of other gases
  • Stability: the sensor performance remains predictable enough, compared to a reference over its intended lifespan

A couple of presentations mentioned using  low cost sensors based upon existing metal oxide technology – the learning here being that the sensor system stability is a challenging issue to manage. Mitigation seems so far to have been to adopt electrochemical type sensors but which can be significantly higher cost.

Hamamatsu was one supplier at the event claiming good individual gas detection capability using light absorption sensing e.g. a sensor set to the band gap of a specific gas. This looks an interesting avenue to explore further.

Overall, the sensor selection is one of the most significant factors for us to consider in our low cost AQ sensing solution.

Urban & air pollution monitoring from vehicles

A couple of interesting talks measuring pollution across journeys.

  • Motorway driving is quite bad for particulates exposure due to vehicle pollution “plumes”.
  • Air re-recirculation in cars provides quite some benefit to exposure levels, as long as the CO2 levels & humidity levels in the cabin don’t build up too much.
  • Urban NO2 hotspots experienced by cyclists on pathways, not only near road junctions but also when passing by industrial areas.
  • AQ pollution hotspots can move position dependent on the wind direction e.g. crossing over to the opposite side of the road. So, dynamic measurements or models are important.


Internet of Things (IoT) niches drive radio specialisation

In a previous blog article looking at radio technologies, we suggested that the winners in the race were likely to be based around Bluetooth, Zigbee and the emergent 5G technologies. Unsurprisingly, it turns out that life is more complicated than this, and there is a lot more going on within selected niches as well as elsewhere outside of the UK.

Whilst collaborating with a smart home energy saving business, OpenTRV, one of the things that becomes obvious is that it is super important in the home environment for devices requiring remote control to be able to communicate with a central/controller hub. There are number of ways of tackling this:

  • Plug all the devices in, use Wi-Fi and hope that all devices can reach the home Wi-Fi hub
  • Plug all the devices in, use Wi-Fi with range extender units e.g. using powerline technology
  • Go battery powered and use a low power “mesh network” of devices based on Bluetooth or Zigbee technology and hope that this will help solve all nodes reaching the hub
  • Go battery powered and use a low power wireless technology that has a better range in the first place e.g. sub-GHz radio based at 433MHz or 868MHz

There are different likelihoods of success and a number of pros and cons with each of these approaches: installation/wiring of sensors to an electricity supply, cost of extra connectivity units, battery replacement costs, data throughput, design margin/certainty of connections etc. In the home environment, product businesses have often tended to pick the last approach for the out of box certainty of connection and are big users of the sub-GHz radio technologies e.g. Lightwave & Mi|Home products.

Now “sub-GHz” wireless technologies may not be that familiar to people who know Bluetooth and Wi-Fi from their mobile phones, but they turn out to be surprisingly well supported by silicon vendors with a wide set of chipset offerings e.g. Texas Instruments CC1310, ST Microelectronics S2-LP, Nordic nRF-905, Silicon Labs EZR32WG, NXP MKW01Z128, Renesas RL78/G1H etc.


Silicon Labs sub-GHz evaluation board

Silicon Labs sub-GHz evaluation board

Whilst the sub-GHz radio solutions for home sensors enjoy longer range e.g. 100m with low power, they do have the disadvantage of being unable to natively communicate with mobile phones or the internet. To do this, they need a compatible receiver box which has to be connected to the home router or Wi-Fi hub. This in itself is not a major issue as all home solutions currently rely on a physical “box” for providing the control element of the solution.

But could this box disappear into the cloud in the future? Certainly, but consumers may become worried if increasing numbers of their critical home systems lack the backup of local controls and they become totally dependent on both their broadband provider AND their home automation service’s cloud operation.

London Tech Expo 2017, IoT products and enablers

London Olympia, site of IoT Tech Expo 2017This is a modified version of an article originally published on LinkedIn here.

I made a worthwhile trip to the IoT London event (23-24th Jan) recently to test the pulse of IoT and find out about some new and upcoming IoT product companies.

In general, I would say it felt like the scale and activity around IoT seems to have increased with a large number of participants and presentations on offer.  With so much to see and businesses to talk to, it would have been useful to have a few more chairs to sit down and catch one’s breath…

Having said that, it is appropriate that this is called the Tech Expo as I could see a lot of product innovation, but also some challenges for businesses in finding their best channels for growth. Notwithstanding, I will mention here a few of the physical product companies that captured my interest..

Nanolike is a French company taking advantage of nanotechnology to create a tiny force sensor which uses a fraction of the power of existing sensing technologies. These size and power advantages mean that there is a wide scope of deployment opportunities, perhaps new products in the quantified self area that become feasible?

BeanIoT is based in Cambridge, UK and has created a range of small autonomous “bean” sensors which can connect to and through mobile phones and other low power bluetooth based devices. The beans have batteries and can be charged wirelessly, with the battery life depending on the number and rate of measurements requested by the bean. There is a quite a wide range of sensing available in the beans: accelerometer (step counter), temperature, pressure, air quality, humidity etc. It is interesting to see such a “Swiss army knife” type proposition being brought forward, as opposed to a more single purpose accessory like a fitness tracker or a wireless weather station. The team is integrating their own cloud storage and ‘bean’ data visualisation platform so as to provide an out of box solution and broaden its appeal toward business.

OpenTRV is a UK company aiming to make a big dent in the costs of domestic heating to cash constrained consumers along with the UK’s CO2 emissions. Their products are a connected and a standalone smart radiator valve that detect presence/occupancy in a room and learn when to turn on and off the radiator. Now existing thermostatic radiator valves can be bought for about £5, but many do not work particularly well nor do they offer the same heat saving potential, with up to 30% saving being claimed. The company is looking at the most affordable product options in order to make a 1 year repayment case to also appeal to people in rental accommodation. The connected option of the valve is more expensive, but can offer “telemetry data” on energy savings e.g. for large scale housing landlords.

The last company I mention is Neurofox, a German company with a product dedicated to helping stressed people achieve a state of mental relaxation in minimum time. The product comprises a headband with 5 brain activity sensors feeding into a controller unit with a headphone audio output and a wireless connection to a pc. The idea is to use the audio feedback path to help train the users to fall into a relaxed state. Over a period of time, through personalised hints and customised feedback, the solution gets better – but how this is achieved i.e. the IoT feedback path is not quite clear yet.

In summary, the show offered an interesting mix of product innovation along with end-end IoT solution companies, data visualisation offerings, multi and wide-area sensor connectivity and connectivity management solutions.  Bearing in mind that google search does not generate a uniform distribution of winners, then for those interested in IoT companies, the list of exhibitors can be found here.